picandocodigo@lemmy.worldM to Nintendo@lemmy.worldEnglish · edit-26 months agoCharted: Video Game Industry Revenues By Year & Platformwww.visualcapitalist.comexternal-linkmessage-square10fedilinkarrow-up145arrow-down11cross-posted to: games@sh.itjust.works
arrow-up144arrow-down1external-linkCharted: Video Game Industry Revenues By Year & Platformwww.visualcapitalist.compicandocodigo@lemmy.worldM to Nintendo@lemmy.worldEnglish · edit-26 months agomessage-square10fedilinkcross-posted to: games@sh.itjust.works
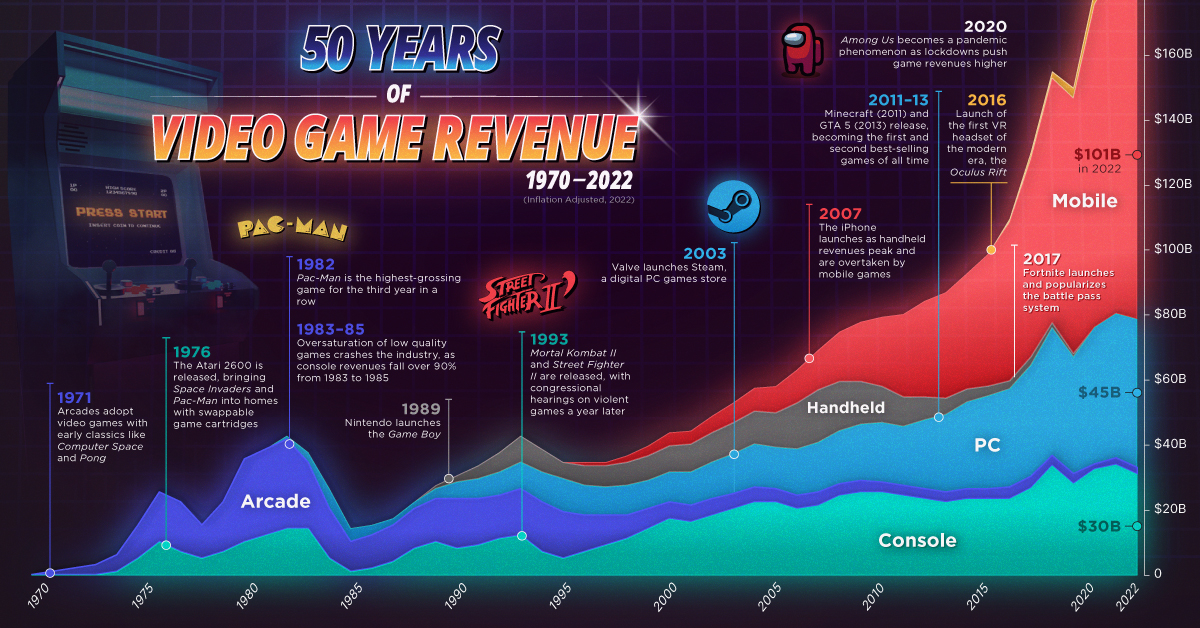
minus-squarejmcs@discuss.tchncs.delinkfedilinkEnglisharrow-up1·edit-26 months agoIt’s a stacked bar chart (i.e. each category’s 0 is the top of the previous category and not the base of the graph).


It’s a stacked bar chart (i.e. each category’s 0 is the top of the previous category and not the base of the graph).